The incident that made me rewrite our agent telemetry looked fine on every chart we had. The p99 latency line was flat and green. Token usage was inside budget. Error rate was a rounding error away from zero. And yet a field operator in our energy-sector deployment got a confidently wrong answer that combined the right question with the wrong asset's maintenance record. The aggregate metrics were not lying, exactly. They were just measuring the wrong thing. Somewhere inside a multi-step run, a reasoning step picked the wrong tool call, the tool returned a plausible-looking result for a different asset id, and the model synthesized it into prose. No span, no attribution, no way to point at the failure. We had built dashboards for a chatbot and shipped a system that takes actions.
Agent observability is not chatbot observability with more tokens. A chat turn is a request and a response, so two histograms cover most of what you need. An agent run is a tree: a turn that plans, calls tools, reads results, reasons again, and sometimes loops. The failure modes live in the edges of that tree, not in the totals at the root. So the rest of this piece is about getting span-level structure into your traces, naming tool calls so you can attribute them, handling the mess that MCP introduces, deciding what content you are even allowed to capture, and turning all of it into something an on-call engineer can replay at 2am.
Why does a green dashboard ship a wrong answer?
Because the metric that went green is an average over a structure it cannot see. When you only record operation duration and token usage at the turn level, a run that made four tool calls collapses into one number. If the third call returned garbage and the model recovered gracefully into a wrong answer, every aggregate stays healthy. The fork that mattered, which tool, which arguments, which result, is exactly the dimension you summed away. You cannot alert on a thing you never recorded as a thing.
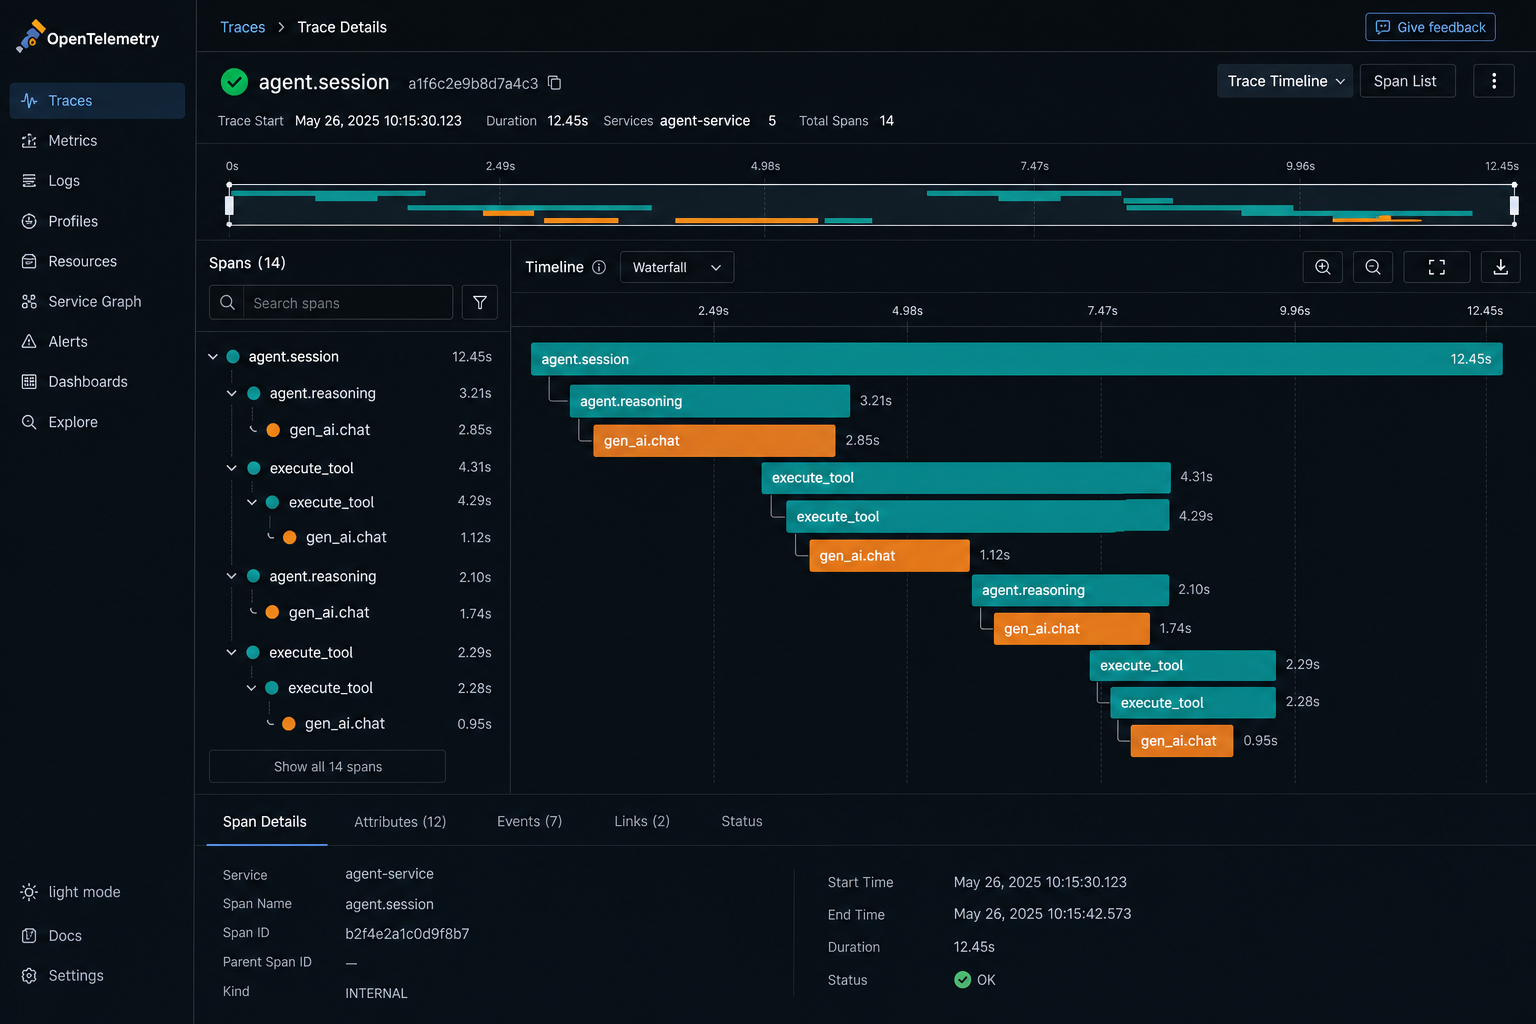
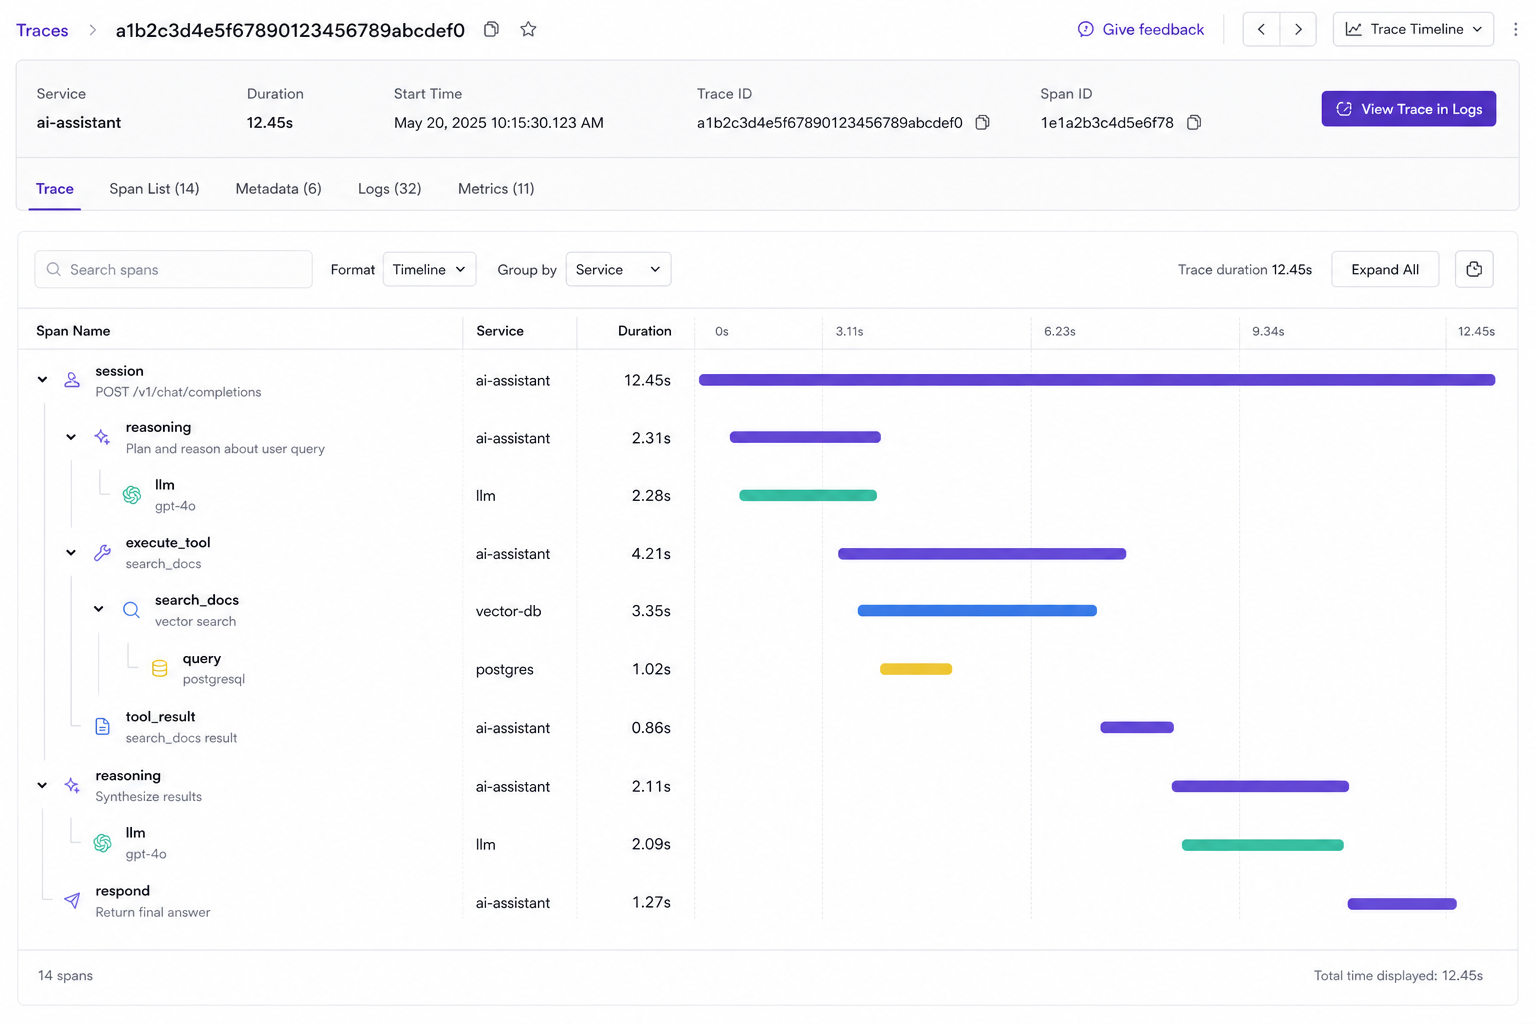
Figure 1 · The span hierarchy
One run, three levels: session over reasoning over tool calls
execute_tool search_docs with a result that does not match the turn, sitting under the exact reasoning step that requested it.Problem: turn-level aggregates erase the tree structure where agent failures actually occur. Constraint: you need attribution per tool call without exploding cardinality or capturing content you are not allowed to keep. Recommendation: model every run as a session span, with reasoning spans and child execute_tool spans beneath it, and record the tool name and a policy-governed result as span attributes. The hierarchy is the product. The metrics ride on top of it.
The metrics floor, and where it stops helping
There is a baseline you should not ship without, and the OpenTelemetry GenAI conventions name it. Digital Applied, in its 2026 tracing and monitoring guide, puts it bluntly: the two histogram metrics are effectively mandatory for any production deployment, gen_ai.client.operation.duration and gen_ai.client.token.usage. Export those, broken down by model and by span, and you can answer the cost and latency questions. The spec itself, in the OpenTelemetry GenAI span conventions, defines span types for agent, workflow, tool, and model operations so that those metrics hang off a real structure rather than floating free.
One caution before you wire dashboards to those attribute names. As Greptime notes, as of May 2026 the GenAI and MCP semantic conventions remain in Development status, and most gen_ai.* attributes can change without a major version bump. So pin the opt-in flag, OTEL_SEMCONV_STABILITY_OPT_IN=gen_ai_latest_experimental, and version your dashboards against it. Treat the convention as a moving target you have chosen to track, not a stable contract. The floor is real, but it is a floor. It tells you a run was slow or expensive. It does not tell you which tool call was wrong, and that is the question that pages you.
MCP will double your spans if you let it
Here is the trap that cost me an afternoon. The moment you put tools behind a Model Context Protocol server, you have two instrumentation layers that both think the tool call is theirs to trace. The agent framework opens an execute_tool span. The MCP server, separately instrumented, opens its own span for the same call. Without context propagation between them, you get Trace A on the agent side and Trace B on the server side, describing one logical action as two disconnected trees. Your waterfall now lies in a new way: the same call appears twice, or worse, the result you care about is stranded in a trace your agent dashboard never joins.
Figure 2 · MCP enrichment
Enrich the existing tool span, do not mint a duplicate
execute_tool span with the MCP attributes instead of creating a second, duplicate span. One span, more context, no broken join.Problem: two instrumentation layers race to own the same tool call and produce disconnected, duplicated traces. Constraint: you cannot drop server-side detail, because the audit story needs the user, agent, and tool view together. Recommendation: propagate trace context across the MCP boundary and configure the server instrumentation to enrich rather than mint. If you are still standardizing that boundary, the production guide to running MCP servers walks through the audit triple of user by agent by tool that this span enrichment makes possible.
The buildInstrument it in five concrete steps
None of the above requires a platform purchase. It is a sequence of decisions you can make in an afternoon and harden over a sprint. Here is the order I run it in, smallest blast radius first.
- Build the three-level hierarchy. Open a session span per user turn, nest reasoning and planning spans under it, and put each tool call in its own child
execute_toolspan. The tree is the foundation; everything else is an attribute on it. - Attribute every tool call. Name spans
execute_tool {gen_ai.tool.name}and record arguments and results as attributes, governed by your content policy. This is what turns "a run failed" into "this call failed." - Layer MCP attributes, do not duplicate. Propagate context across the server boundary so MCP detail enriches the existing tool span instead of opening a parallel trace.
- Export the GenAI metrics floor. Emit the latency histogram and token usage, split input and output, per span. Those are the two numbers finance and on-call both ask for.
- Decide content capture before you ship. Default prompt and completion capture off, and make full content an opt-in or external-storage decision rather than a default that quietly accumulates risk.
Do this Monday
Run this checklist against one production agent before you add anything new:
1. Does a single user turn produce a session span with nested tool spans, or one flat span? 2. Can you point at a specific execute_tool span and read its tool name and result? 3. When a tool sits behind MCP, do you see one enriched span or two traces? 4. Are gen_ai.client.operation.duration and gen_ai.client.token.usage exported per span? 5. Is prompt and completion capture off by default with a documented opt-in path? The first question you answer with "no" is your next instrumentation ticket.
What about the prompts themselves?
The most useful debugging attribute, the actual prompt and completion content, is also the most dangerous thing to record by default. In a regulated deployment, capturing every completion turns your trace backend into an unmanaged copy of customer data, with all the retention, access, and deletion obligations that implies, and none of the controls. The conventions get this right by recommending content capture stay off by default. MLflow and the OpenInference work it references add structured fields like message.tool_call_results so you can correlate tool calls without dumping raw payloads everywhere.
Figure 3 · Content capture modes
Three modes for prompt and completion capture, each with a different blast radius
The honest counterpoint is that vendor platforms like LangSmith or Braintrust give you faster time to value than wiring raw OpenTelemetry, and for a small team that is a reasonable trade. The reason I still anchor on OTel is decoupling: the convention lets me change backends without re-instrumenting, and the SRE-grade pipeline guidance from OpenObserve treats LLM traces as just another OTel signal flowing into the same stack as the rest of my services. One pipeline, one retention policy, one place to reason about access.
On callReplaying a run at 2am
The payoff for all of this is the replay. When the page fires, you should be able to take the trace id off the alert, pull the full span tree, and walk it like a stack trace until you find the bad tool span. No guessing from averages, no asking the user to reproduce it, no scrolling a token chart hoping a spike confesses. The structure you instrumented is the structure you debug.
Figure 4 · The on-call replay
From alert to fix without leaving the trace
That closing loop is where observability stops being a dashboard and starts being a flywheel. Every replayed incident is a mined example, and the blueprint for an agent eval harness is built to consume exactly these traces as golden cases. The same span data does double duty on cost: once you have per-span token attribution, you can see which tool path or model choice is burning the budget, which is precisely the input the work on controlling agent cost at scale uses to make routing decisions. Trace once, debug, eval, and bill from the same structure.
Production metrics, or it didn't happen
I do not trust an agent I cannot replay. A green latency chart told me a corrupted result was healthy, and that was the day I stopped treating averages as truth. The span hierarchy is what gives you back the thing the aggregates threw away: the fork in the run, the tool that chose wrong, the result that should have failed the turn. It is not glamorous work. It is the same distributed-tracing discipline we have applied to microservices for a decade, pointed at a non-deterministic client. But it is the difference between an incident you can name in five minutes and one you argue about for a week.
So draw the three levels for your own agent this week. Session over reasoning over tools, results as governed attributes, MCP enriching rather than duplicating, content capture off until you choose otherwise. Then break it on purpose in staging and replay the trace. If you can point at the bad span before the coffee is done, you have observability. If you are still reading a token chart, you have a dashboard, and a dashboard has never told me which tool failed.
Token counts tell you what a run cost. The span tree tells you what it did, which tool it trusted, and where it went wrong. Only one of those gets you off the page.
Comments (4)
Join the discussion
Sign in to comment, bookmark threads, and continue lessons across sessions.