The question came in a renewal review, the kind of meeting where a year of work gets compressed into one slide. Our VP of Operations looked at the agent program I had spent eight months building, the n8n flows and the MCP tools and the little critic that sat at the end of each one, and asked the only question that ever really matters: "How many hours did this save us?" I had a number ready. It was big and it was flattering and I did not believe it, because I had watched it get assembled out of assumptions about how long a human "would have" taken on tasks no human was ever going to do. So I did something that felt risky at the time. I put the hours-saved slide away and pulled up a different one: the count of bad outputs the system had rejected before they shipped. That slide is the reason the program got renewed, and the reason I now build every automation ROI case around it.
I want to be clear about what kind of piece this is. It is not a finance lecture, and I am not a CFO. I am the person who wires the workflows together and then has to stand in a room and defend why they cost what they cost. So this is operator advice, written from the inside of the spend, about how to measure an automation program so that the people holding the budget can see what it is actually doing. The thesis is short enough to put on a sticky note: agent ROI is measured in prevented bad outputs, not generation volume. Everything below is me earning that sentence.
The shiftThe industry already moved off the productivity number
Here is the part that surprised me, because it suggests I was late rather than early. The way buyers justify agent spend has measurably changed. In the exploreagentic.ai AI-agent ROI playbook, citing Futurum survey data, the share of organizations naming direct financial impact as their primary ROI metric rose to 21.7% in the first half of 2026, while the share leaning on productivity gains fell to 18%. Those two lines crossed. The market that used to sell on "minutes saved" is shifting to "money moved," and it is doing so because the productivity story stopped clearing renewal.
The playbook is blunt about why, and the line stuck with me because it described my own first slide: "Productivity-minute arithmetic is why the first wave of agent programs lost their renewal." That is the trap. Hours-saved is a seductive metric precisely because it is unfalsifiable. You pick a baseline duration for the manual version of a task, multiply by volume, and out comes a number large enough to make anyone nod. But nobody on the finance side can audit it, and the moment they cannot audit it, they discount it to roughly zero. A number that cannot be checked is not evidence. It is decoration.
The same playbook pairs this with the structural reason the value gap is so wide. Per a McKinsey survey from November 2025, roughly 88% of firms report adopting AI while only about 39% report enterprise-level EBIT impact. Almost everyone has the tools. Fewer than two in five can point to the bottom line and show the dent. That spread is not a capability problem, because the capability is clearly in the building. It is a measurement and operationalization problem, and operators who can close it on their own program are the ones who keep their budgets.
Baseline before you ship, or you forfeit the comparison
The single most expensive mistake I made early was deploying first and trying to reconstruct the "before" later. You cannot. Once the agent is in the flow, the old process erodes within weeks, people stop logging the manual steps, and any baseline you assemble afterward is just the hours-saved fiction wearing a lab coat. The discipline that fixes this is boring and it is non-negotiable: you measure the workflow as it runs today, by hand, before a single agent touches it.
Pickaxe's ROI guidance puts a clock on it that matches what I have lived: take a 30 to 60 day pre-deployment baseline, then commit to a 6 to 12 month measurement window before you make a final call on the program. Both ends of that range are load-bearing. The four-to-eight-week baseline is long enough to capture the normal variance of a workflow, its bad weeks and its quiet ones, so your "before" is a distribution and not a lucky Tuesday. The six-to-twelve-month tail is the part executives hate, because it does not produce a quarterly win, and I will come back to that tension because it is real.
What you measure during the baseline is the unglamorous list: cycle time on the named workflow, cost per unit of work, error rate, and SLA breaches. Pick one workflow, name it, and instrument exactly that. Resist the urge to baseline the whole department. A program that can prove a clean result on one well-chosen flow survives; a program that gestures vaguely at organization-wide uplift does not.
Figure 1 · the measurement window
Baseline before deploy, then measure long enough to be believed
The primary metricIf you track one thing, track outcome rate
Once you have a baseline, you need a headline metric, and I will save you the months I spent flailing between candidates. Make it outcome rate. Pickaxe states it about as directly as a vendor ever states anything: "If you're tracking one metric, make it Outcome Rate. It's the single best indicator of whether the agent is actually delivering business value." I resisted this at first because it sounded like a slogan. It is not. It is a discipline, and the discipline lives in the definition.
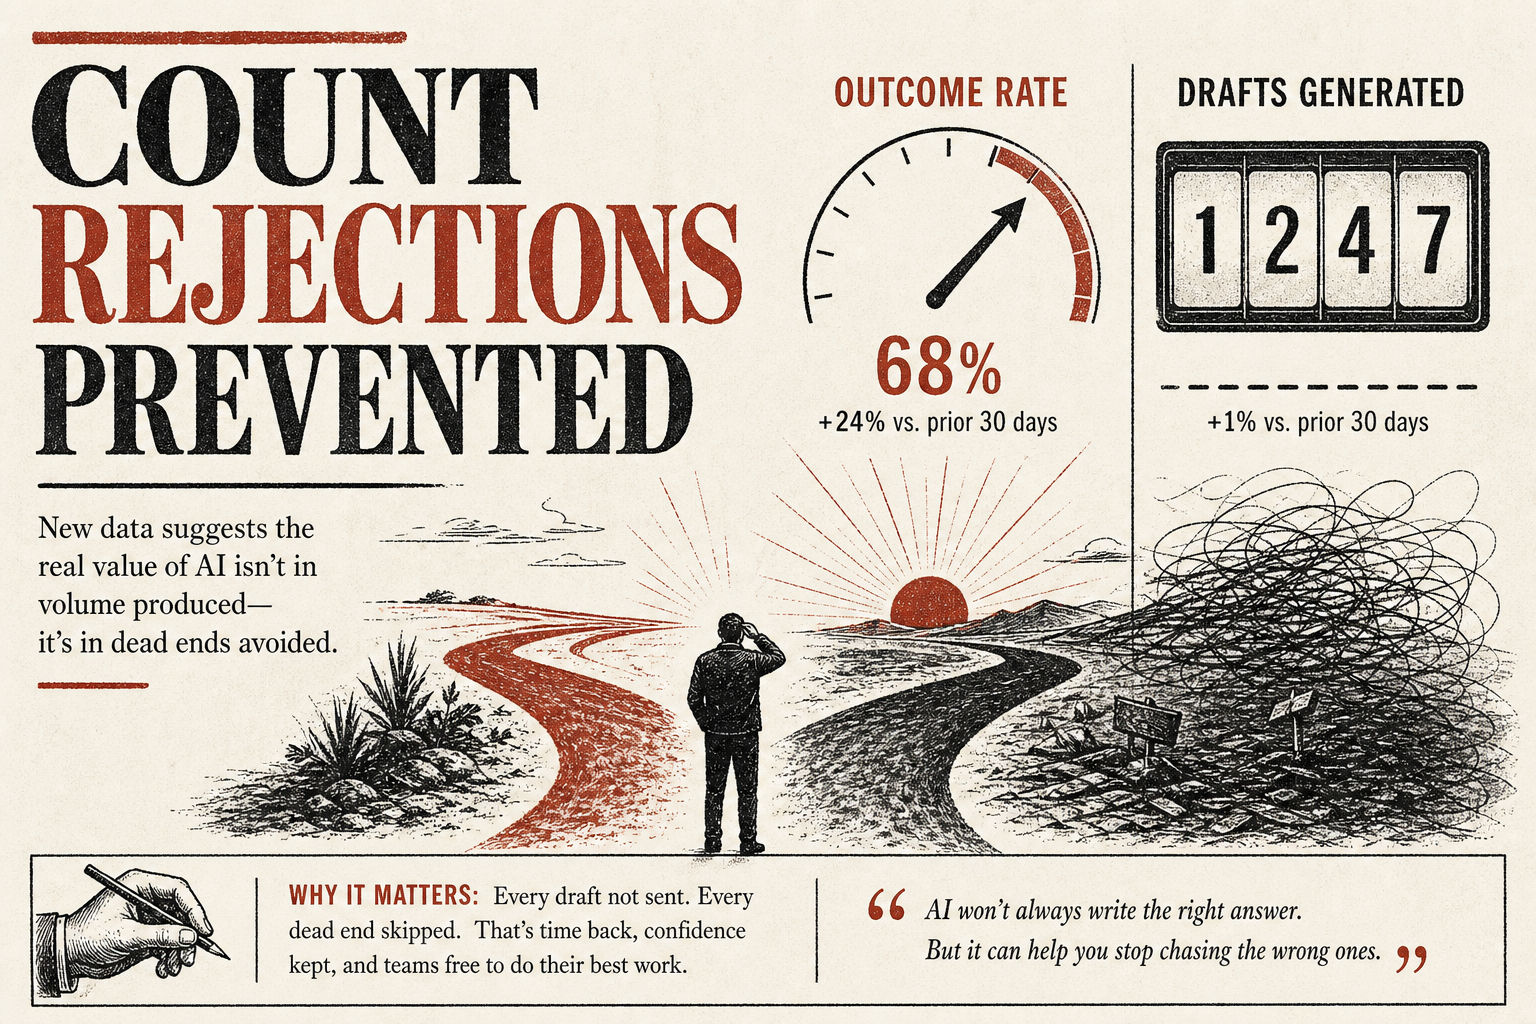
Outcome rate asks a harder question than the metrics most dashboards default to. Task completion asks "did the agent finish." Deflection asks "did the human go away." Drafts generated asks "how much did it produce." None of those asks the only question the business cares about: did the interaction achieve the actual outcome it existed to produce. A support agent that closes a ticket without solving the problem completed its task, deflected the human, and generated a tidy response. Its outcome rate on that interaction is zero, because the customer is coming back angrier tomorrow. The metric only works if you define the outcome in business terms for that specific workflow, which is exactly why it is harder to instrument than a token count, and exactly why it is worth more.
The honest cost of this metric is that it does not come for free out of your logging stack. You have to decide, per workflow, what "good" means, and then you have to capture enough signal to score against it. For our document-review flow, the outcome was "the reviewed artifact passed downstream sign-off without rework." For our intake-triage flow, it was "the item landed in the right queue and stayed there." Different definitions, same shape: a real business event downstream, not an internal milestone the agent can declare for itself.
Figure 2 · the report you actually show finance
Outcome up, cost down, errors and escalations down
Rejection is the metric, not the exception
Now to the part the title is about. The most under-counted value an automation program produces is the bad output it stops. Every workflow I run ends in a check of some kind, an eval gate, a critic pass, a validation rule, and that check rejects work. Those rejections are not failures of the system. They are the system doing the most valuable thing it does, which is catching a wrong answer before it becomes a customer's problem, a compliance incident, or a downstream cleanup that costs ten times the original task.
So I count them. Error-rate delta against the baseline, escalation rate, and the raw count of outputs the critic layer rejected before ship. That last one is the number I put in front of leadership, framed exactly this way: in the measurement window, the system produced N artifacts and prevented M of them from reaching a human in a state we would have had to apologize for. M is a defensible number. It is logged, it is auditable, and it maps to a real cost avoided, because every one of those M would otherwise have been caught by a person later, or worse, by a customer. This is the same instinct that the piece on scaling your "no" argues for at the level of judgment: a confident, well-instrumented rejection is a unit of value, not a unit of friction.
The reason most teams cannot report this is that they never built the layer that makes a rejection legible. You need an eval harness that scores outputs against task-specific checks, so that "rejected" means something precise and reproducible rather than "the model seemed unsure." Standing one up is its own discipline, and if that is the gap in your stack, the eval-harness blueprint is the practical starting point. Without it, your error-rate delta is just another unfalsifiable number, and we already established what finance does with those.
There is also a research-grade version of this argument worth knowing about, because it tells you where the discipline is heading. Microsoft Research's AgentRx work on diagnosing agent failures from execution trajectories makes the case that a scalar pass/fail score is too coarse to localize where a long-horizon agent actually broke. The operator translation is direct: if you can attribute a rejection to a specific failing step, your "prevented bad outputs" number stops being a tally and becomes a map of where the workflow is weak. And Anthropic's guidance on building evals for agents reinforces the same point from the design side: the eval is not an afterthought you bolt on for reporting, it is the instrument that makes outcome and error rates real in the first place.
The cadenceRenewal is a reporting rhythm, not a results spike
Here is the lesson that took me the longest to internalize, because it is about process rather than metrics. The programs that survive year-two renewal are not the ones with the most dramatic numbers. They are the ones with a boring, predictable reporting rhythm that a finance partner signed off on before the agent ever shipped. The ROI playbook says it plainly: "The programs that clear year-two renewal have a fixed cadence, a fixed format, and a finance partner who signed off before the agent shipped."
Read every clause of that, because each one is a decision you make up front or regret later. Fixed cadence: the same report on the same date every quarter, so the conversation is never "what do you have for me," it is "here is the quarterly update you already expect." Fixed format: the same four trends from Figure 2, so nobody spends the meeting arguing about which metrics count. Finance partner who signed off before ship: this is the one operators skip, and it is the one that matters most. If finance agreed to the metric definitions before the agent went live, then the metrics are theirs as much as yours, and a number someone helped define is a number they will defend in the renewal room.
Figure 3 · the cadence that earns the second year
Four quarterly reports into one finance sign-off gate
Where this gets hard, honestly
I would not trust this playbook if I sold it to you without the failure modes, so here are the three that have bitten me or nearly did.
Outcome rate is genuinely harder to instrument than vanity metrics. Token counts and draft volumes fall out of your logs for free. Outcome rate requires you to define a business result per workflow and then capture downstream signal to score against it, which is real engineering work and sometimes real organizational negotiation. I am not going to pretend otherwise. The trade is that you get a number worth defending instead of a number worth ignoring, but you pay for it in instrumentation.
The 6-to-12-month window collides with quarterly impatience. Executives want AI wins this quarter, and a tail metric does not cooperate. The only thing that has worked for me is setting that expectation out loud, in the same meeting where finance signs off on the metrics: this is a program we judge on the window, not the week, and here is the leading indicator we will watch in the meantime. Pick a leading indicator, usually the rejection count, that moves early so the long window does not feel like silence. Underneath all of this is the cost question, and a clean treatment of complete cost accounting for agent programs lives in the piece on agent cost at scale, which is the other half of an honest ROI formula.
Deflection can hide bad outputs that "resolved" incorrectly. This is the one that scares me most, because it looks like success. An agent that closes interactions fast posts a beautiful deflection rate while quietly producing wrong answers customers have not complained about yet. The defense is to never report deflection alone. Pair it with a CSAT delta or a downstream rework rate, so a rising deflection number that comes with falling satisfaction gets caught instead of celebrated. An outcome that was not really an outcome is exactly the bad output this whole framework exists to count.
Reporting hygiene
The metric-shift figures (21.7% financial impact, 18% productivity, 88/39 adoption-versus-EBIT) are from the exploreagentic.ai ROI playbook citing Futurum and McKinsey. The baseline and window durations are Pickaxe. These are point-in-time survey figures; open the source before you paste any of them into a board deck, because the percentages drift quarter over quarter and a stale number is worse than no number.
The slide I show now
So when leadership asks how many hours the automation stack saved, I still do not lead with that number, and I have made peace with it. I lead with outcome rate against a baseline we measured before we shipped, the trend in cost per resolution, and the count of bad outputs the system rejected before any of them reached a customer. It is a less flattering deck than the hours-saved one. It is also the one that has survived two renewal reviews, because every figure on it is something finance helped define and can audit on demand.
The automation glue underneath all of this, the n8n flows and the MCP tools and the retry semantics that keep it from double-charging anyone at 2am, is its own craft, and I wrote up those patterns in the n8n and MCP workflow piece. But the glue is not what gets the program funded. What gets it funded is the willingness to measure the thing that is hard to measure, report it on a rhythm finance can trust, and count the rejections as the wins they are. Agent ROI is not how much your stack generated. It is how much it stopped you from shipping. Count that, and you will keep your budget.
Comments (4)
Join the discussion
Sign in to comment, bookmark threads, and continue lessons across sessions.